Basic theoretical provisions of network planning. Network planning and management
As noted in the previous chapter, most of the ongoing building processes can be represented in the form of graphs, diagrams, tables, etc., which serve as a model of the actual building process.
The models considered above are linear models that establish the technological sequence for the execution of individual works within a certain time frame. Line graphs give a visual representation of the progress of construction and installation works only in time, linking, as a rule, 30...40 different types of work. With the help of such schedules, you can highlight the work performed simultaneously or at certain intervals, as well as determine the amount of required resources. However, line charts do not reflect all the links between individual jobs, making it difficult to identify jobs that regulate the entire course of the production process; according to them it is difficult, and sometimes impossible, to establish the maximum permissible dates for the start of individual works and the time reserves for their implementation, to determine the need to accelerate certain works at various facilities.
The most widely used method of network planning and, which meets modern requirements for the organization of production.
Network planning and production management, which makes it possible to improve operational management, improve the culture of production, is aimed at achieving a specific goal of a set of works and is widely used not only in the construction industry, but also in many other sectors of the national economy.
The conditional economic and mathematical model of the production process proposed by J. E. Kelly and M. R. Walker largely eliminates the shortcomings of the linear graph.
Compared to traditional methods of planning and management, network models have a number of advantages: the most complete relationship between jobs in a certain technological sequence; focusing the attention of managers on the work on which the duration of the entire program depends; maximum reduction of the influence of random or "volitional" factors with the possibility of analyzing options and choosing the optimal one; implementation of clear control over the progress of work and prevention of violation of planned deadlines; the possibility of using computers to calculate the parameters of the network model.
The use of network models for the organization and management of construction and installation works can significantly reduce the construction time of various facilities, while reducing the cost of construction.
Network models are compiled for simple and complex processes. In models of simple processes, the complexity and duration of the work performed are considered with the determination of a possible reduction in the latter. Models of complex processes reflect the issues of planning material and technical resources and time in order to determine their most economical ratios.
If the network model covers up to 200...300 jobs, it can be calculated manually (determining the cost of time, material and technical resources, technical and economic indicators). With more work, the calculation becomes cumbersome and the efficiency of the model is lost. In such cases, the model parameters are calculated on a computer using special programs.
To build a network model of construction processes, a complete list of works of a particular process is compiled. The sequence of recording works can be arbitrary, but to facilitate the construction of the model, it is desirable to arrange them in a technological sequence.
The network model of a complex construction process is depicted as a geometric diagram, which is a system of lines (arrows) that connect certain points (circles). Circles indicate events, arrows - work (Fig. 3.1). The work indicated by the arrow in the network model has several semantic meanings: the actual work is a construction process that requires time and resource costs (work that has labor intensity and duration); waiting - a technological break between two adjacent works, requiring only time costs (work that has duration and does not have labor intensity, for example, concrete hardening); dependence (link) - is depicted on the model as a dotted arrow and has neither time nor resource costs, but indicates that the execution of this work depends on the completion of another. The nature of the links will be discussed below.
Any work is limited on both sides by events that assign a number or code to the work. A network model event that has no previous work is assigned a zero number, it is called the initial one. An event that does not have subsequent work indicates the end of all work and is called the final one. In a single-target network model, there can only be one start and one end event. Events that limit work on both sides are called initial and final.
For example, works 0-1 and 0-2 shown in fig. 3.1 have a common start event 0, which is the initial event for the entire model, and works 5-6 and 4-6 have a common end event 6, which is at the same time the final event for the entire model.
Any sequence of activities from the initial event to the final event is called a path, the duration of the path is determined by the sum of the durations of its constituent activities. The longest path from the initial to the final event is called the critical path of the network model.
Rice. 3.1. Process model in the form of a network diagram
On fig. 3.1. a fragment of the network model is shown, in which, under the arrows (works), their duration in days is indicated. There are several paths from the initial to the final events, the duration of which is given below:
Duration
Full way full way, days
0-1-3-5-6......... . . 5 + 4 + 3 + 8 = 20
0-2-3-5-6........... 7 + 3 + 8=18
0-2-4-5-6........... 7 + 6 + 8=21
0-2-4-6............ 7 + 6 + 7 = 20
The critical path in this example is the 0-2-4-5-6 path of 21 days. The rest of the non-critical paths have some slack that can be used on the jobs that make up this path. Critical paths are shown as thick lines on network diagrams.
Network models of construction processes are built according to certain rules: there can be only one job between two events: if there are several jobs that have common initial and final events, additional events and connections are introduced; the network model should not have dead ends (events that do not enter or leave any work) and closed loops; if the work can be started with partial completion of the previous one, then the completed stage is separated into independent work and an additional event is introduced; each job or relationship must have an end event that only allows the start of the job to which it relates; repetition of event numbers in the model is not allowed.
International University of Nature, Society and Man
"Dubna"
Department of System Analysis and Management
Discipline abstract
"Development of management decisions"
"Network management
and planning"
Is done by a student
Shadrov K.N., gr. 4111
Checked:
Bugrov A.N.
Introduction
Relevance This work is due to the need for competent management of large national economic complexes and projects, scientific research, design and technological preparation of production, new types of products, construction and reconstruction, overhaul of fixed assets through the use of network models.
Target work - describe and understand what, in general, is network planning and management (SPM).
To achieve this goal, you need to solve the following tasks:
Ø highlight the history of SPU,
Ø show what the essence and purpose of the SPU is,
Ø define the main elements of the STC,
Ø specify the rules for constructing and ordering network diagrams,
Ø describe the time indicators of the STC,
Ø give rules for network optimization,
Ø show the construction of a network graph on a time scale.
History of network planning and management
Network planning techniques were developed in the late 1950s in the United States. In 1956, M. Walker of DuPont, exploring ways to make better use of the firm's Univac computer, joined forces with D. Kelly of Remington Rand's Capital Planning Group. They tried to use a computer to draw up scheduling of large complexes of works on the modernization of the factories of the DuPont company. As a result, a rational and simple method for describing a project using a computer was created. It was originally called the Walker-Kelly method and was later called critical path method- MCP (or CPM - Critical Path Method).
In parallel and independently, the US Navy created the PERT (Program Evaluation and Review Technique) method for analyzing and evaluating programs. This method was developed by Lockheed Corporation and the consulting firm Booz, Allen & Hamilton for the implementation of the Polaris missile system project, involving about 3800 major contractors and consisting of 60 thousand operations. Using the PERT method allowed the program management to know exactly what needed to be done at any given time and who exactly should do it, as well as the likelihood of individual operations being completed on time. The management of the program was so successful that the project was completed two years ahead of schedule. With such a successful start, this method of management was soon used for project planning throughout the US military. The technique has proven itself well in coordinating the work performed by various contractors as part of large projects to develop new types of weapons.
Large industrial corporations began to apply a similar management technique almost simultaneously with the military to develop new types of products and modernize production. The method of work planning based on the project has been widely used in construction. For example, to manage a hydroelectric project on the Churchill River in Newfoundland (Labrador Peninsula). The cost of the project was 950 million dollars. The hydroelectric power plant was built from 1967 to 1976. This project included more than 100 construction contracts, some of which cost as much as $76 million. In 1974, the progress of the project was 18 months ahead of schedule and within the planned cost estimates. The customer for the project was Churchill Falls Labrador Corp., which hired Acress Canadian Betchel to design and manage construction.
In essence, a significant gain in time was formed from the use of accurate mathematical methods in the management of complex work packages, which became possible due to the development of computer technology. However, the first computers were expensive and available only to large organizations. Thus, historically, the first projects were state programs that were grandiose in terms of the scale of work, the number of performers and capital investments.
Initially, large companies developed software to support their own projects, but soon the first project management systems appeared on the software market. The systems at the origin of planning were designed for powerful mainframe computers and networks of minicomputers.
The main indicators of systems of this class were their high power and, at the same time, the ability to describe projects in sufficient detail using complex network planning methods. These systems were aimed at highly professional managers managing the development of the largest projects, who are well acquainted with network planning algorithms and specific terminology. As a rule, project development and project management consultations were carried out by special consulting firms.
The stage of the most rapid development of project management systems began with the advent of personal computers, when the computer became a working tool for a wide range of managers. A significant expansion of the range of users of management systems has created a need to create systems for project management of a new type, one of the most important indicators of such systems was ease of use. Management systems of the new generation were developed as a project management tool that is understandable to any manager, does not require special training and provides easy and quick start-up. Time Line belongs to this class of systems. The developers of new versions of systems of this class, trying to preserve the external simplicity of the systems, invariably expanded their functionality and power, and at the same time kept low prices, which made the systems affordable for companies of almost any level.
Currently, there are deep traditions of using project management systems in many areas of life. Moreover, the bulk of the planned projects are small projects. For example, studies by InfoWorld weekly show that 50 percent of users in the US require systems to support schedules of 500-1,000 jobs, and only 28 percent of users develop schedules with more than 1,000 jobs. In terms of resources, 38 percent of users need to manage 50-100 resources in a project, and only 28 percent of users need to manage more than 100 resources. As a result of the research, the average sizes of project schedules were also determined: for small projects - 81 jobs and 14 types of resources, for medium projects - 417 jobs and 47 types of resources, for large projects - 1,198 jobs and 165 types of resources. These figures can serve as a starting point for a manager considering the usefulness of moving to a project-based form of managing the activities of his own organization. As you can see, the application of a project management system in practice can be effective for very small projects.
Naturally, with the expansion of the circle of users of project management systems, there is an expansion of methods and techniques for their use. Western trade journals regularly publish articles on project management systems, including advice to users of such systems and analysis of the use of network planning techniques to solve problems in various areas of management.
In Russia, work on network management began in the 60s. Then the SPU methods found application in construction and scientific developments. Subsequently, network methods began to be widely used in other areas of the national economy.
Essence and purpose of network planning and management
The more complex and larger the planned work or project, the more difficult the tasks of operational planning, control and management. Under these conditions, the use of the calendar schedule may not always be sufficiently satisfactory, especially for a large and complex facility, since it does not allow reasonable and efficient planning, choosing the best option for the duration of work, using reserves and adjusting the schedule in the course of activities.
The listed shortcomings of the linear calendar schedule are largely eliminated when using a system of network models that allow you to analyze the schedule, identify reserves and use electronic computers. The use of network models provides a well-thought-out detailed organization of work, creates conditions for effective management.
The whole process is reflected in a graphical model called a network diagram. The network schedule takes into account all work from design to commissioning, determines the most important, critical work, the completion of which determines the completion date of the project. In the process of activity, it becomes possible to adjust the plan, make changes, and ensure continuity in operational planning. Existing methods for analyzing the network diagram make it possible to assess the degree of influence of the changes being made on the course of the program, to predict the state of work for the future. The network schedule accurately indicates the activities on which the duration of the program depends.
Basic elements of network planning and management
Network planning and management is a set of calculation methods, organizational and control measures for planning and managing a set of works using a network diagram (network model).
Under work package we will understand any task, for the accomplishment of which it is necessary to carry out a sufficiently large number of various works.
In order to draw up a work plan for the implementation of large and complex projects, consisting of thousands of separate studies and operations, it is necessary to describe it using some mathematical model. Such a tool for describing projects is a network model.
network model- this is a plan for the execution of a certain complex of interrelated works, given in the form of a network, the graphic representation of which is called network diagram.
The main elements of the network model are work and developments.
The term work in SPU has several meanings. First, this actual work- a time-consuming process that requires resources (for example, assembling a product, testing a device, etc.). Each actual work must be specific, clearly described and have a responsible performer.
Secondly, this expectation- a time-consuming process that does not require labor costs (for example, the process of drying after painting, metal aging, concrete hardening, etc.).
Thirdly, this addiction, or fictitious job- a logical connection between two or more works (events) that do not require labor, material resources or time. It indicates that the possibility of one job directly depends on the results of another. Naturally, the duration of the fictitious work is assumed to be zero.
An event is the moment of completion of a process, reflecting a separate stage of the project. An event can be a particular result of a single activity or a summary result of several activities. An event can take place only when all the work preceding it is completed. Subsequent work can only begin when the event is complete. From here dual nature of the event: for all works immediately preceding it, it is final, and for all immediately following it, it is initial. It is assumed that the event has no duration and is accomplished, as it were, instantaneously. Therefore, each event included in the network model must be fully, accurately and comprehensively defined, its formulation must include the result of all the work immediately preceding it.
Picture1 . Basic elements of the network model
When compiling network graphs (models), symbols are used. Events on the network diagram (or, as they say, on the graph) are depicted by circles (vertices of the graph), and works - by arrows (oriented arcs):
- event,
Work (process),
Dummy work - used to simplify network diagrams (duration is always 0).
Among the events of the network model, the initial and final events are distinguished. The initiating event has no previous activities and events related to the work package represented in the model. The final event has no follow-up activities and events.
There is another principle of building networks - without events. In such a network, the vertices of the graph mean certain jobs, and the arrows represent dependencies between jobs that determine the order in which they are performed. The “work-communication” network graph, in contrast to the “event-work” graph, has certain advantages: it does not contain fictitious jobs, it has a simpler construction and restructuring technique, it includes only the concept of work that is well known to performers without the less familiar concept of an event.
At the same time, networks without events turn out to be much more cumbersome, since there are usually much fewer events than jobs ( network complexity index, equal to the ratio of the number of jobs to the number of events, as a rule, is significantly greater than one). Therefore, these networks are less efficient in terms of complex management. This explains the fact that at present the most widely used network diagrams "event-work".
If there are no numerical estimates in the network model, then such a network is called structural. However, in practice, networks are most often used in which estimates of the duration of work are given, as well as estimates of other parameters, for example, labor intensity, cost, etc.
The procedure and rules for constructing network graphs
Network schedules are drawn up at the initial stage of planning. First, the planned process is divided into separate works, a list of works and events is compiled, their logical connections and sequence of execution are thought out, the works are assigned to the responsible executors. With their help and with the help of standards, if any, the duration of each work is estimated. Then it is compiled ( stitched together) network diagram. After streamlining the network schedule, the parameters of events and work are calculated, time reserves are determined and critical path. Finally, the analysis and optimization of the network schedule is carried out, which, if necessary, is drawn anew with the recalculation of the parameters of events and work.
When constructing a network diagram, a number of rules must be observed.
1. The network model should not have “dead end” events, that is, events from which no work exits, with the exception of the final event. Here, either work is not needed and must be canceled, or the need for a certain work following the event in order to accomplish any subsequent event is not noticed. In such cases, it is necessary to carefully study the interrelationships of events and activities in order to correct the misunderstanding that has arisen.
2. There should be no “tail” events in the network diagram (except for the initial one) that are not preceded by at least one work. Having found such events in the network, it is necessary to determine the performers of the previous works and include these works in the network.
3. The network should not have closed loops and loops, that is, paths connecting some events with themselves. When a contour occurs (and in complex networks, that is, in networks with a high complexity index, this occurs quite often and is detected only with the help of a computer), it is necessary to return to the original data and, by revising the scope of work, achieve its elimination.
4. Any two events must be directly related by at most one arrow job. Violation of this condition occurs when displaying parallel works. If these works are left as they are, there will be confusion due to the fact that two different works will have the same designation. However, the content of these works, the composition of the involved performers and the amount of resources spent on the work may differ significantly.
In this case, it is recommended to enter dummy event and fictitious job, while one of the parallel jobs closes on this dummy event. Dummy jobs are depicted on the graph by dotted lines.
Figure 2. Examples of introducing dummy events
Dummy jobs and events need to be introduced in a number of other cases. One of them is a reflection of the dependence of events that are not related to real work. For example, jobs A and B (Figure 2, a) can be performed independently of each other, but according to the production conditions, job B cannot start before job A ends. This circumstance requires the introduction of fictitious job C.
Another case is the incomplete dependence of jobs. For example, work C requires the completion of work A and B for its beginning, work D is connected only with work B, and does not depend on work A. Then the introduction of fictitious work Ф and fictitious event 3' is required, as shown in Figure 2, b.
In addition, fictitious jobs may be introduced to reflect actual delays and expectations. In contrast to the previous cases, here the fictitious work is characterized by a length in time.
If the network has one end goal, then the program is called single-purpose. A network diagram that has several final events is called a multi-purpose one and the calculation is carried out with respect to each final goal. An example would be the construction of a residential community, where the commissioning of each house is the end result, and the schedule for the construction of each house is determined by its own critical path.
Network ordering
Suppose that when compiling a certain project, 12 events are selected: 0, 1, 2, 3, 4, 5, 6, 7, 8, 9, 10, 11 and 24 activities connecting them: (0, 1), (0, 2 ), (0, 3), (1, 2), (1, 4), (1, 5), (2, 3), (2, 5), (2, 7), (3, 6), (3, 7), (3, 10), (4, 8), (5, 8), (5, 7), (6, 10), (7, 6), (7, 8), (7 , 9), (7, 10), (8, 9), (9, 11), (10, 9), (10, 11). Compiled the original network diagram 1.
The ordering of the network diagram consists in such an arrangement of events and jobs, in which for any job the preceding event is located to the left and has a lower number compared to the event that completes this job.. In other words, in an ordered network diagram, all the arrow jobs are directed from left to right: from events with lower numbers to events with higher numbers.
Let's divide the original network graph into several vertical layers (we circle them with dotted lines and denote them with Roman numerals).
Having placed the initial event 0 in the I layer, we mentally delete this event and all the arrow-works emerging from it from the graph. Then event 1, which forms layer II, will remain without incoming arrows. Having mentally crossed out event 1 and all the work coming out of it, we will see that events 4 and 2 remain without incoming arrows, which form layer III. Continuing this process, we get network diagram 2.
Network Diagram 1. Unordered Network Diagram
Network Diagram 2. Organizing a Network Diagram with Layers
Now we see that the initial numbering of events is not quite correct: for example, event 6 lies in the VI layer and has a number less than event 7 from the previous layer. The same can be said about events 9 and 10.
Network Diagram 3. Ordered Network Diagram
Let's change the numbering of events in accordance with their location on the chart and get an ordered network chart 3. It should be noted that the numbering of events located in the same vertical layer is of no fundamental importance, so the numbering of the same network chart can be ambiguous.
The concept of the path
One of the most important concepts of a network diagram is the concept of a path. A path is any sequence of activities in which the end event of each activity coincides with the start event of the activity following it.. Among the various paths of a network diagram, the most interesting is full path- any path, the beginning of which coincides with the initial event of the network, and the end - with the final one.
The longest complete path in a network diagram is called critical. Works and events that are on this path are also called critical.
In network diagram 4, the critical path passes through jobs (1;2), (2;5), (5;6), (6;8) and is equal to 16. This means that all jobs will be completed in 16 units of time. The critical path is of particular importance in the SPM system, since the work of this path will determine the overall completion cycle of the entire set of works planned using the network schedule. Knowing the start date of work and the duration of the critical path, you can set the end date for the entire program. Any increase in the duration of activities on the critical path will delay program execution.
Network diagram 4. Critical path
At the stage of management and control over the progress of the program, the main attention is paid to the work that is on the critical path or, due to lagging behind, has fallen on the critical path. To reduce the duration of the project, you must first reduce the duration of the activities that lie on the critical path.
Time parameters of network diagrams
Early (or expected) date of the event is determined by the duration of the maximum path preceding this event.
The delay in the completion of the event in relation to its early date will not affect the completion time of the final event (and, therefore, the duration of the work package) until the sum of the completion time of this event and the duration (length) of the maximum of the paths following it does not exceed length of the critical path.
That's why late (or deadline) date of the event is equal to the difference between the maximum time of occurrence of the event following the work and the time of work before this (future) event.
Event slack is defined as the difference between the late and early dates of its completion.
The event slack shows how long the event can be delayed without causing an increase in the duration of the work package.
Critical events do not have time reserves, since any delay in the completion of an event lying on the critical path will cause the same delay in the completion of the final event.
From this it follows that in order to determine the length and topology of the critical path, it is not at all necessary to enumerate all the full paths of the network and determine their lengths. Having determined the early term of the network's final event, we thereby determine the length of the critical path, and, having identified events with zero time reserves, we determine its topology.
If the network has a single critical path, then this path passes through all critical events, that is, events with zero slack. If there are several critical paths, then it can be difficult to identify them using critical events, since both critical and non-critical paths can pass through some of the critical events. In this case, to determine the critical paths, it is recommended to use critical works.
An individual job can start (and end) at early, late, or other intermediate times. In the future, when optimizing the schedule, any placement of work is possible in a given interval, called duration of work.
It's obvious that early start time coincides with the earliest occurrence of the preceding event.
Early end of work coincides with the early date of the subsequent event.
Late start time coincides with the latest occurrence of the preceding event.
Late end of work coincides with the late date of the subsequent event.
Thus, within the framework of the network model, the start and end times of work are closely related to neighboring events by appropriate restrictions.
If the path is not critical, then it has reserve time, defined as the difference between the length of the critical path and the path under consideration. It shows by how much the duration of all activities belonging to this path can be increased in total. From this we can conclude that any of the work of the path on its section that does not coincide with the critical path (closed between two events of the critical path) has a reserve of time.
There are four types of work time reserves.
Full slack of work shows how much it is possible to increase the time for completing this work, provided that the deadline for completing the set of works does not change.
The total slack of the work time is equal to the slack of the maximum of the paths passing through this work. This reserve can be placed in the execution of a given work if its initial event occurs at the earliest possible date, and the completion of the final event can be allowed to occur at its latest date.
An important property of a total job slack is that it belongs not only to that job, but to all full paths passing through it. When using the full slack for only one job, the slack of other jobs lying on the maximum path passing through it will be completely exhausted. The time reserves of jobs lying on other (non-maximal in duration) paths passing through this job will be reduced accordingly by the amount of the used reserve.
The rest of the operating time reserves are parts of its total reserve.
Private slack of the first kind there is a fraction of the total slack by which the duration of the activity can be increased without changing the late date of its initial event. This reserve can be disposed of when performing this work on the assumption that its initial and final events are completed at their latest dates.
Private slack of the second kind, or free time reserve The work time represents the portion of the total slack by which the duration of the work can be increased without changing the early date of its end event. This reserve can be disposed of during the performance of this work on the assumption that its initial and final events will take place at their earliest dates.
Free time can be used to prevent accidents that may occur during the execution of work. If you plan the execution of work according to the early start and finish dates, then it will always be possible, if necessary, to switch to late start and finish dates.
Independent slack work - a part of the total reserve of time received for the case when all previous work ends late, and all subsequent work starts early.
The use of independent slack does not affect the amount of slack for other activities. Independent reserves tend to be used when the completion of the previous work occurred at a late acceptable date, and they want to perform subsequent work at an early date. If the value of the independent reserve is zero or positive, then there is such a possibility. If this value is negative, then this possibility does not exist, since the previous work has not yet ended, and the next one should already begin. That is, the negative value of this value has no real meaning. In fact, only those jobs that do not lie on the maximum paths passing through their initial and final events have an independent reserve.
Thus, if the private time reserve of the first type can be used to increase the duration of this and subsequent work without spending the time reserve of previous work, and the free time reserve can be used to increase the duration of this and previous work without violating the time reserve of subsequent work without violating the time reserve of subsequent work , then the independent time slack can be used to increase the duration of only this activity.
Activities on the critical path, like critical events, do not have time reserves.
Figure 3. The key to calculating the sector method
It should be noted that in the case of fairly simple network diagrams, in addition to the tabular method for calculating the parameters of network diagrams, it can be applied sector representation time parameters, that is, the calculation of parameters can be made on the chart itself. Each event for this is divided into four sectors. In the left sector, the events record the early start of work, in the right - the late end, in the upper - the number of this event, in the lower - the number of the previous event, from which the path of maximum duration goes to this event. Occurs when the event number is put in the lower sector and the upper sector is not filled. Certain time reserves are written under the arrow in the form of a fraction: in the numerator, the general reserve, and in the denominator, the private reserve.
Network diagram 5. Sector representation of time parameters
In reality, in practice, the duration of work, their actual state may change. In this case, the expected time of the event, completion of work, and the critical path may also change. Knowing the critical path, management can focus on those activities that are critical in terms of completion dates for all activities.
Analysis and optimization of the network diagram
After finding the critical path and work time reserves and assessing the probability of completing the project on time, a comprehensive analysis of the network schedule should be carried out and measures should be taken to optimize it. This very important stage in the development of network diagrams reveals the main idea of the STC. It consists in bringing the network schedule in line with the given deadlines and capabilities of the organization developing the project.
Optimization of the network diagram, depending on the completeness of the tasks to be solved, can be conditionally divided into private and complex. species private optimization network diagram are: minimization of the execution time of a set of works at a given cost; minimization of the cost of a set of works for a given project execution time. Comprehensive optimization is to find the optimal ratio of the cost and timing of the project, depending on the specific goals set during its implementation.
First, let us consider the analysis and optimization of calendar networks, in which only estimates of the duration of work are given.
The analysis of the network schedule begins with the analysis of the network topology, including the control of the construction of the network diagram, the establishment of the appropriateness of the choice of works, the degree of their division.
Then the classification and grouping of works according to the magnitude of the reserves are carried out. It should be noted that the value of the total reserve of time by no means always can accurately characterize how stressful the execution of this or that work of the non-critical path is. It all depends on which sequence of work is covered by the calculated reserve, what is the duration of this sequence.
It is possible to determine the degree of difficulty of completing each group of work on a non-critical path on time using the coefficient of work intensity.
work stress factor is the ratio of the duration of non-coinciding, but concluded between the same events, segments of the path, one of which is the path of maximum duration passing through this work, and the other is the critical path.
This factor can vary from 0 (for jobs where the segments of the maximum path that do not coincide with the critical path consist of fictitious jobs of zero duration) to 1 (for jobs on the critical path).
Let's pay attention to the fact that a larger total reserve of one job (compared to another) does not necessarily indicate a lower degree of intensity of its implementation. This is explained by the different proportion of the total reserves of work in the duration of the segments of the maximum paths that do not coincide with the critical path.
The calculated stress coefficients make it possible to additionally classify works by zones:
Ø critical K > 0.8,
Ø subcritical 0.6< К < 0,8,
Ø reserve K< 0,6.
Optimization of the network schedule is a process of improving the organization of the implementation of a set of works, taking into account the deadline for its implementation. Optimization is carried out in order to reduce the length of the critical path, equalize the work intensity coefficients, and rationally use resources.
First of all, measures are taken to reduce the duration of activities that are on the critical path. This is achieved:
Ø redistribution of all types of resources, both temporary (use of time reserves of non-critical paths) and labor, material, energy, while the redistribution of resources should, as a rule, go from zones that are less stressful to zones that combine the most stressful work.
For example, it is possible to increase the number of shifts in work on “narrow” construction sites. This measure is the most effective, since it allows you to achieve the desired result with the same leading machines (excavator, machine tool, etc.), only by increasing the number of workers.
Ø reducing the labor intensity of critical work by transferring part of the work to other ways that have time reserves;
Ø revision of the network topology, changes in the scope of work and network structure.
Ø ensure parallel (combined) work;
Ø divide a wide front of work into smaller areas or areas;
Ø It is possible to reduce the duration of the program by changing the technology used, for example, in construction, replacing monolithic reinforced concrete structures with prefabricated, other prefabricated elements manufactured at the factory.
When adjusting the schedule, it must be borne in mind that workers are saturated with resources up to a certain limit (so that each worker is provided with a sufficient front of work and has the opportunity to comply with safety regulations).
In the process of reducing the duration of work, the critical path may change, and in the future, the optimization process will be aimed at reducing the duration of the new critical path, and this will continue until a satisfactory result is obtained. Ideally, the length of any of the full paths can become equal to the length of the critical path, or at least the path of the critical zone. Then all work will be carried out with equal stress, and the project completion time will be significantly reduced.
The most obvious option for private optimization of the network schedule, taking into account the cost, involves the use of work time reserves. The duration of each job that has a slack is increased until the slack is exhausted or until the upper duration value is reached. It is advisable to increase the duration of each work by the amount of such a reserve so as not to change the early timing of the onset of all network events, that is, by the amount of free time reserve.
In practice, when trying to effectively improve the drawn up plan, it is inevitable to introduce, in addition to the estimates of the terms, the cost factor of the work. The project may require the acceleration of its implementation, which, of course, will affect the cost: it will increase. Therefore, it is necessary to determine the optimal ratio between the cost of the project and the duration of its implementation.
When using the time-cost method, it is assumed that the decrease in the duration of work is proportional to the increase in its cost. The increase in cost with decreasing time is called acceleration costs.
It is very effective to use the method of statistical modeling based on multiple successive changes in the duration of work (within specified limits) and "playing" on the computer various variants of the network diagram with calculations of all its time parameters and work stress factors.
For example, you can take as the initial plan, which has the minimum values of the duration of work and, accordingly, the maximum cost of the project. And then sequentially increase the duration of the complex of works by increasing the duration of works located on non-critical, and then on the critical (critical) path to a satisfactory value of the project cost. Accordingly, it is possible to take as the initial plan, which has the maximum duration of work, and then successively reduce their duration to such an acceptable value for the duration of the project.
The process of "playing" continues until an acceptable version of the plan is obtained or until it is established that all available opportunities for improving the plan have been exhausted and the conditions set for the project developer are unfeasible.
At present, in practice, the network is first corrected in time, i.e., it is brought to a given completion date for construction. Then they begin to adjust the schedule according to the criterion of resource allocation, starting with labor resources.
It should be noted that with a linear dependence of the cost of work on their duration, the problem of constructing an optimal network graph can be formulated as a problem linear programming, in which it is necessary to minimize the cost of the project while limiting, firstly, the duration of each work within the established limits, and, secondly, the duration of any complete path of the network diagram is not more than the established project deadline.
Building a network graph in time scale
In practice, network graphs compiled on a time scale with reference to calendar dates have become widespread. When monitoring the progress of work, such a schedule will allow you to quickly find work performed in a certain period of time, set them ahead or behind, and, if necessary, reallocate resources.
A network diagram drawn up on a time scale makes it possible to build graphs of the need for resources and thereby establish their correspondence with their actual availability. The construction of a network graph on a time scale is carried out according to the early start or late completion of work and proceeds sequentially from the initial event to the final one.
It is convenient to link a network diagram to a calendar using a calendar ruler, which records years, months and dates (excluding weekends and holidays). Using the table, you can easily find the calendar start or end date of work.
Network Diagram 6. Network Diagram over Time
In cases of changes in the initial data and the actual progress of the work, the network diagram, drawn up in relation to the scale, causes complications in its adjustment. Therefore, this method is applicable for relatively small network graphs.
Conclusion
Based on the foregoing, it can be argued that network planning and management methods provide managers and performers in all areas of work with sound information that they need to make decisions on planning, organization and management. And when using computer technology, SPM is no longer just one of the planning methods, but an automated method of managing the production process.
Sources used
1. webforum.land.en is a project management forum in Russia.
Tutoring
Need help learning a topic?
Our experts will advise or provide tutoring services on topics of interest to you.
Submit an application indicating the topic right now to find out about the possibility of obtaining a consultation.
Network planning is used to organize and scheduling the implementation of large work packages. These are, for example, scientific research work involving several institutes, the development of an automated accounting system, the construction of a large facility, the development of the production of a new machine, the planning and implementation of space research, etc. In all these cases, a huge number of interchangeable operations are performed, many people, enterprises, organizations; management is complicated by the novelty of the development, the difficulty of accurately determining the timing and upcoming costs. In the management of complex developments, highly effective network methods that have become widespread in recent years. Using these methods makes it relatively easy to find out when it is necessary to start and end the execution of individual operations, how the delay in the progress of some operation affects the completion time of the entire project.
To use network methods, it is necessary, first of all, to break a large project into separate operations (works) and compile a list of operations. Some of them can be executed at the same time, others - only in a certain order. For example, when building a house, walls cannot be erected before the foundation is made. It is necessary to find out the order of execution of all list operations.
To do this, we compile a list of operations immediately preceding each operation. After that, you need to plan the time required to complete each operation. The resulting data is usually placed in a table. Example:
Table 10.1
|
Operation |
Previous Operations | |
|
| ||
|
| ||
|
|
| |
|
|
| |
|
|
|


The table shows the data for the project, which consists of six works. For each of them, the duration is set and the operations immediately preceding it are indicated. Can be built from this data network diagram, or graph. But first, a few concepts from graph theory. Graph is a collection of two finite sets: sets of points, which are called peaks, and sets of pairs of vertices, which are called ribs.


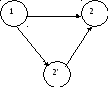
Rice. 10.1 Graph example
This is an example of a graph that has five vertices and six edges. If we consider a set of ordered pairs of points, i.e. a direction is given on each edge, then the graph is called oriented. Otherwise, it is an undirected graph.
Edges that have the same end vertex are called parallel.
An edge whose end vertices coincide is called loop. Figure 10.1 a 4 and a 5 - parallel ribs a 2 - the loop. The count is called complete if any two of its distinct vertices are connected by an edge and it does not contain parallel edges.
way in a graph is called such a sequence of edges leading from some initial vertex P 1 to the end peak P n, in which every two adjacent edges have a common vertex, and no edge occurs more than once. For example, in an example graph, the sequence of edges (a 1 , a 2 , a 3 , a 4 , a 5 , a 6 ) forms a path leading from the top P 1 to the top P 4 .
cycle A path whose start and end vertices are the same is called. On fig. 10.1 form an edge cycle (a 1 , a 3 , a 4 ) .
long way or cycle is the number of edges of this path or cycle.
In directed graphs, the edges are given a direction, i.e. Each edge has a fixed start and end. Such directed edges are called arcs.
network A graph is called, each arc of which is assigned a certain number (or several numbers), usually this is time.
Thus, when constructing a graph, each operation is depicted as an oriented arc. Relationships between operations are also represented as an arc. Arc - connection is carried out from the end of the arc corresponding to the previous operation to the beginning of the next operation.

Fig.10.2 Network diagram of a set of works
To distinguish operations from relationships, operations are shown as solid lines and relationships as dotted lines. The vertices of the graph are called events. The time of occurrence of an event is the time when all operations included in the corresponding vertex are completed.
Thus, a graph representing the relationship of individual project activities is called a network diagram. In Figure 10.2, a network graph is built for a set of operations given by the table from the previous example.
The main elements of the network diagram are events and activities. Event- this is a state, the moment of achieving the intermediate or final goal of development ( start event starting point of development). The event has no duration in time. Work is a time-consuming process necessary for the accomplishment of an event. Any work has a preceding event and ends with a certain event.
After the initial drawing up of the network schedule, it is necessary to check its compliance with some mandatory requirements:
Only start events have no incoming arrows, only end events have outgoing ones. If an event is intermediate in nature, it must have both incoming and outgoing arrows.
Each job must have an antecedent and an ending event.
There should be no isolated sections on the schedule that are not connected by work with the rest of the schedule.
There should be no contours (cycles) and loops on the chart, because they essentially mean that the condition for the beginning of some work is its end.
Rice. 10.3 Circuit example
If a contour appears (and this happens quite often in complex networks), it is necessary to return to the original data and, by revising the scope of work, achieve its elimination.

Rice. 10.4 An example of introducing a dummy event to eliminate the parallelism of work
This is one of the cases where the introduction of fictitious jobs and events is required.
Another case is a reflection of the dependence of events that are not related to real work. Suppose, for example, that the work a and b(see figure) can be run independently of each other, but require the same hardware, so work cannot start until the hardware is free and the job is finished a. This circumstance requires the introduction of a fictitious work c (fig.10.5).

The third case is incomplete dependence of works. For example, work c requires completion of work in order to start a and b but work d only related to work b, but from work a does not depend.
Then the introduction of a fictitious work is required x and dummy event  , as shown in figure 10.6.


In all three of these cases, the fictitious jobs do not have a length in time, however, without including them, the analysis of the network diagram may give incorrect results.
The fourth case of introducing fictitious jobs is a reflection of real delays and expectations. In a number of technological processes, for example, natural ripening, fermentation, hardening, drying, etc. are required, when real work is not done, but the next stage cannot begin until a certain moment. In such cases, fictitious jobs are introduced into the network schedule, which have a corresponding length in time.
Let's analyze the network diagram (Figure 10.7 on the next page), obtained in the original version according to the following table data - the list of works and events (Table 10.2). This schedule meets all the above requirements. However, this graph is not completely ordered. The ordering of the network diagram consists in such an arrangement of events and works, in which, roughly speaking, all works - the arrows are directed only from left to right. In each vertical “layer” of the ordered chart there are events that have previous events only in the layers located to the left.
Table 10.2
|
previous |
final |
|

Fig.10.7 Unordered network diagram
To select layers and completely arrange our graph, we will do the following. Having placed the initial event 1 in the first layer (see Fig. 10.8), we mentally cross out this event and the arrows emerging from it on the chart. Then events 2 and 3 will remain without incoming arrows. They form the second layer. Having mentally crossed out events 2 and 3 with the jobs coming out of them, we find that event 4 remains without incoming arrows, which thus forms the third layer. Continuing the elimination procedure, we get the fourth layer with events 5 and 6, the fifth with event 7, the sixth with events 8 and 9, and finally the seventh layer with the final event 10.


Fig.10.8 Ordered network diagram
It is already clear at first glance that compared to the previous schedule, the ordered schedule (Fig. 10.8) reflects the sequence of events and works much more clearly and visually. In complex "tangled" networks, the ordering of the graph is the primary condition for its subsequent analysis. Note that a correctly drawn graph can always be ordered, which cannot be said, for example, about a graph containing contours. Using the deletion method, we obtain the correct numbering of the vertices of the graph. The final vertex then receives the highest number.
Time parameters of the network diagram
Each work of the network schedule (except for fictitious works) requires time, labor and material resources for its implementation. The most important stage of network planning is the analysis of the network schedule according to the time criterion. Consider the principles of this analysis on the example of our chart.
Assume that the duration of each job can be set with sufficient accuracy. For now, we only consider the so-called normative temporary estimates of work. They can, for example, be installed by an expert. The numbers next to the arrows in the figure show the duration of the work (in days).
First of all, let us determine the expected timing of the occurrence of all events in the schedule. We will consider the start time of the initial event to be zero. Since work 1 - 2 lasts 10 days, event 2 will obviously occur on the tenth day after the start of work. Similarly, we determine that it will take 4 days for the occurrence of event 3. For event 4, 2 jobs are incoming: 1 - 4 and 3 - 4. The first of them ends on the sixth day after the start of the work.
Work 3 - 4 can only start after event 3 occurs, i.e. 4 days after the start of the event, and requires 7 days to complete. In total, 11 days pass from the initial event to the completion of work 3 - 4. Since event 4 cannot happen before the end of work 3 - 4, the expected date of its occurrence should be considered 11 days.
Let's move on to event 5. It occurs after the completion of activities 2 - 5 and 4 - 5. The first of them is completed in 10 + 9 = 19 days, the second in 11 + 3 = 14 days. The longer of these periods (19 days) is the expected date of occurrence of event 5. Similarly, we determine the expected dates of occurrence of all other events. The final event 10 occurs 51 days after the initial one, this period obviously determines the duration of the entire development as a whole.
Returning now from the final event to the initial one, let's see how this period was formed - 51 days. Of the three jobs included in event 10, this period was determined by job 8 - 10, which begins with the onset of event 8 (42 days) and lasts 9 days (42 + 9 = 51 days). In turn, the time of occurrence of event 8 was determined by work 7 - 8 (30 + 12 = 42 days). The timing of event 7 is directly related to activity 6–7, event 6 to activity 4–6, event 4 to activity 3–4, and event 3 to activity 1–3.
As you can see, there is some chain of work leading from the initial event to the final one, which determines the total expected duration of the entire set of network activities. From the initial event to the final one, it is possible to build a set of successive chains of works (paths) of various total lengths. Of all the possible paths, the path 1 - 3 - 4 - 6 -7 - 8 - 10, which we found on the chart, has the longest duration (51 days), moving in stages from the final event to the initial one.
The sequence of work between the initial and final events of the network, which has the greatest total length in time, is called critical path. Events and activities located along this path are also called critical.
The critical path is a central concept in network planning and management. Naturally, the most important goal of analyzing the network schedule by the time criterion is to establish the total duration of the entire planned set of works. It turns out that this total duration is determined not by all the jobs in the network, but only by the jobs lying on the critical path. An increase in the execution time of any critical work leads to a delay in the completion of the entire set of works, while a delay in the execution of non-critical work may not affect the timing of the final event.
From this follows important practical conclusions. Development managers should prioritize the timely completion of critical work, providing them with the necessary labor and material resources, so as not to disrupt the completion of the entire project. If this period itself, according to the originally drawn up schedule, turned out to be higher than the directive, then in order to reduce it, it is necessary to study the possibilities of reducing precisely critical, and not any work. Considering that critical activities account for only 10-15% of the total number of activities in real network diagrams, it is clear what a valuable management tool the critical path method is in the hands of managers of complex developments.
A network diagram may contain not one, but several critical paths. If, for example, on our graph, work 9 - 10 lasted not 11, but 15 days, then the network would contain two critical paths: the path we have already found 1 - 3 - 4 - 6 - 7 - 9 - 10. No matter how many on a critical path graph, all the work that lies on them directly affects the timing of the end event.
Let us describe the methods described above for determining the considered temporal characteristics of the network in general terms.
Assume that the execution of work started at the time  . Let
. Let  predetermined duration of work
  . Values
  are written on the corresponding arcs of the network graph and considered as their lengths.
Early start time called the smallest allowable time when work can be started.
If from the top  several works are published, then the early dates for the start of these works coincide and are called early event
  .
.
Early start time  designate
 , and the early date of the event
  . Usually, for convenience, the values
  write in the upper third of each vertex:
If the work started at an early start time, then its end time is called early completion of work. Early end of work  denoted
  .
.
Ford's algorithm is used to calculate the early timing of events. It is believed that the numbering of the vertices is correct.
Algorithm for calculating early dates for the beginning and end of work.

The entry under the maximum means: the search is carried out among such numbers  what works
  belong to the set included in the vertex
  arcs.
arcs.
Number  - that vertex, when moving from which the value is obtained
  , are brought to the left side of the top
  .
.
After finding the value  You can calculate the early dates for the start and end of work:
  .
.
Critical time and critical path
The earliest time for the end event to occur is called the critical time and is denoted  The entire project cannot be completed ahead of time
  those. Critical time is the minimum deadline for completing the entire complex of works. On the network diagram
  is the length of the longest path from the start vertex to the end vertex.
Any path of length equal to  from the start vertex to the end vertex is called in a critical way.
Algorithm for constructing the critical path
Start building from the end vertex. In its left third is the number of the peak, when moving from which the early date of the event was determined. The critical path goes from the final vertex to the vertex with this number; then to the vertex whose number is in the left third of the vertex obtained during the movement, and so on until the initial vertex.
If for critical events no delays in their occurrence are unacceptable without the threat of disruption of the entire project, then for non-critical events such delays are possible. There are only three non-critical events on our chart: 2, 5 and 9. Let's take event 9. According to the schedule, it occurs 36 days after the initial event, but it could also occur in 40 days if 11 days are added to 40 for work 9 - 10, then it will turn out 51 days, i.e. event 10 will not be violated. If event 9 occurs after 41 days, then this will already lead to a delay in the completion of the entire complex of works. So 40 days is latest allowable date event 9.
Event 5 occurs 19 days after the start of work, but the critical event 8 following it occurs only after 42 days, and this period would not be violated if event 5 occurred even 37 days after the initial event (42 - 5) = 37 ). Then event 2 could also occur 28 days after event 1 (37 - 9 = 28).
Thus, non-critical events, along with the expected date of occurrence, have the latest admissible date of occurrence (given in brackets for non-critical events). For critical events, these dates coincide.
Non-critical jobs may also have known time reserves its execution. Take, for example, work 4 - 7. The preceding event 4 occurs 11 days later, and the final event 7 occurs only 30 days after the start of work. Obviously, the timing of event 7 would not be violated if activity 4 - 7 lasted 19 days - 15 days more than its scheduled duration. These 15 days are free time reserve works 4 - 7.
The free reserve of working time 6 - 9 is 8 days (36 - 7 - 21 = 8). Work 7 - 9, although it is non-critical, does not have a free time reserve, the same applies to work 1 - 2 and 2 - 5 (free time reserves are indicated in the figure in brackets by the arrows of work). It is clear that critical work has no time reserves.
When determining the reserves of work time, another line of reasoning can be adopted. Let's say for job 6 - 9 the maximum allowable execution time is 19 days (12 days reserve). But with such a duration of work 6 - 9, event 9 will not occur at the expected, but at the latest admissible date (40 days), which, as we have seen, does not violate the deadlines for the entire project. So, along with a free reserve of time equal to 8 days, work 6 - 9 has full time reserve- 12 days.
Job 7 - 9 has no free time reserve, but its full reserve is 4 days (40 - 6 - 30 = 4). Full time reserves, other than free reserves, also have work 1 - 2 (18 days), 2 - 5 (18 days), 4 - 5 (23 days).
Let's write these temporal characteristics of the network graph in general form:
Late end of work is the latest allowable completion time of work without violating the deadline for completing the entire project  . Late end of work
  denoted
  and is determined by the formula:
  .
.
late deadline
 event
event
 the latest completion date for all jobs included in the corresponding vertex is called. Algorithm for calculating the late dates of the event:

Thus, for the final vertex, the late date of occurrence of events coincides with the execution time of the entire project. Then all vertices are looked through in descending order of their numbers. For each vertex, the set of all outgoing jobs is considered. From the late dates for the onset of their ends, the duration of these works is subtracted. The minimum of these differences is equal to  . the value
  usually written for convenience on the right side of the top
  .
.
From the algorithm for calculating late dates, it follows that the increase in the latest project completion date  on the
  units leads to an increase in the late timing of the occurrence of all events also by
  units.
After defining  You can calculate the late start and finish dates for all project activities:
  .
.
Time reserves.
Consider some work  . Find the time that can be allocated to complete this work without delaying the completion date of the entire project. Work
  cannot start early
  and must be completed no later than
  . To complete this work, you need to spend no more
  units of time. According to the plan, this work can be done for
  units of time.
The maximum allowable time for which you can increase the duration of the work  or delay the start so that it does not delay the execution of the entire project is called full time reserve.
Full runtime reserve  designate
  , it is equal to:
 .
.
If the total slack of some work is equal to zero, then the delay in its execution will cause the same delay in the execution of the entire project.
If at some work its full reserve is used, then the path passing through this work will become critical. The total slack of any work along this path will become zero.
Finding extra time to do the work  without introducing additional restrictions on the time of execution of subsequent work. To do this, the work must be completed by the time
  . Thus, it is possible to distinguish
  units of time to complete work
  .
.
Value  called free working time reserve
 . If you use the free reserve on some operation, then subsequent work can still be started at their earliest dates.
Determining slack, events, and activities in a network schedule is important both during the development and adjustment phase and during project execution.
Firstly, there may be “bottlenecks” in the project in terms of providing labor or material resources for simultaneously ongoing work. Suppose, for example, that when analyzing our example graph, we found difficulties in recruiting performers in the period after 21 days, when activities 5 - 8, 6 - 7 and 6 - 9 are performed. These difficulties disappear with the onset of event 7 (30th day). Obviously, then, for a more even distribution of performers, it is possible to delay until the onset of event 7 the start of work 5 - 8, which has a significant free time reserve. Such a delay, as already noted, is reflected in the schedule by the introduction of fictitious work.
Secondly, in the originally drawn up schedule, the total duration of the work may be higher than the directive period. To meet this deadline, you obviously need to reduce the duration of some activities on the critical path. This is usually possible, but subject to the involvement of additional resources for these works. They can be freed up by lengthening the duration of non-critical activities, and the calculated slack will show to what extent such a lengthening is permissible. (However, it should be borne in mind that with a reduction in the duration of critical activities and an increase in non-critical activities, the critical path itself may change).
Thirdly, already in the process of project implementation, there are often deviations from the planned deadlines for the execution of work and the occurrence of events. For non-critical work and events, the actual delay against the schedule may not affect the timing of the entire project in any way - if the delay is within the time reserves. Knowing these reserves will show management whether the delay that is occurring is acceptable or if it threatens to derail the schedule as a whole and should be prevented by all measures.
The described method for calculating slack allows, as has already been shown in the example, to determine the critical path as a sequence of events that do not have slack. A number of other algorithms for determining the critical path have also been proposed, in particular, those that are well adapted to the processing of network graphs on a computer.
Network charts compiled for practical purposes usually have hundreds, and often thousands of events and activities. More difficult to analyze are those graphs in which the number of jobs far exceeds the number of events. The ratio of the number of jobs to the number of schedule events is considered indicator (coefficient) of network complexity. Complex networks are processed on a computer. The machine checks the correctness of the schedule, arranges it, determines the critical path and its length in time, the time reserves of non-critical events and work. As a result of the network analysis, the machine prints out a list of critical events and jobs and their parameters, the timing of occurrence and time reserves of events, a list of jobs ordered depending on the time reserve or other features, and other information provided by the program.
When determining the characteristics of the network schedule, it was assumed that the execution time of each work is precisely known - it is deterministic. This proposal is actually implemented quite rarely, since the main direction of using network methods is the planning of new complex developments, which often had no analogues at all in the past. Therefore, most often the duration of the work of the network graph is indefinite, in the mathematical sense - a random variable. If the law of distribution of a random variable is known, then it is not difficult to find its two most important characteristics - the mean value (mathematical expectation) and the variance. However, in relation to the work of the network diagram, it is usually not possible to confidently judge the law of probability of the time of specific works.
For every job  , the exact duration of which cannot be established, three time estimates are determined based on a survey of performers and experts.
a) evaluation  minimum time in which work can be completed under the most favorable set of circumstances
  (also called the optimistic estimate).
b) evaluation  the maximum time it will take to complete the job under the most unfavorable conditions (pessimistic estimate)
  .
.
c) evaluation  most likely time to complete the job under normal conditions
  .
.
These three estimates are the basis for calculating its variance. In this case, a hypothesis is used about a certain probability law of work durations (the so-called  - distribution). In an algorithmic sense, the hypothesis makes it possible to construct simple formulas for determining the average expected duration for each job
  and dispersion
  given
given  and
and  .
.

 .
.
Values  determine the duration of the work on the network diagram. On their basis, the timing of events and time reserves are calculated. The time of occurrence of the event is determined by the sum of the average values of the duration of work on the longest path leading from the initial event to the given one, as in the case of deterministic durations of work. The variance of the time of occurrence of an event is equal (more precisely, it is taken equal to) the sum of the variances of the durations of the same jobs of the longest path leading to the event. The process of determining the time reserves of events and activities does not differ from the corresponding calculation in the deterministic case.
The algorithm for calculating a network diagram with a probabilistic time of operations execution includes the following main steps:
1. Calculation of the expected time to complete the work  and dispersion
  .
.
2. Calculation of the earliest possible date of occurrence of the end event  (algorithm described earlier).

Building a network model
Table 10.3
|
|
|
|
0
Rice. 10.9 Process network diagram with probabilistic execution times |
|


The expected time is taken as the estimated time for performing operations (Table 10.4).
Table 10.4
|
|
|
Operations |


Study of the network model
Initially, we calculate the earliest possible date for the occurrence of the final event  , using algorithms for calculating a deterministic network graph. Then we define the critical path. As a result of the calculation
  days (Fig. 10.10).
Then we calculate the argument of the normal probability distribution function for the critical path:
 .
.
Using the table of values of the probability distribution function (see Table 10.3), we determine the probability  .
.

Fig.10.10 Network diagram of the process with calculation results
Network Model Optimization
When judging the temporal characteristics of events, network planning relies on the central limit theorem of probability theory, which states that the sum of a large number of independent random variables (in this case, the duration of work) under certain general conditions has a normal distribution with an average value equal to the sum of the average values of these variables , and a variance equal to the sum of these variances.
When analyzing network diagrams by the criterion of time, it turned out that the reduction or increase in the duration of work is associated, as a rule, with an increase or decrease in the costs of these works. The existence of various options for a network schedule with different levels of costs allows us to talk about the possibility of finding the best options. It is natural, in particular, to raise the question of which of the options for the network schedule for a given total duration of the project is carried out at the lowest cost. With a different formulation of the problem, a variant of accelerating the complex of works is sought, requiring a minimum increase in costs.
The simplest approach used in the practice of network planning assumes that each job has the following costs: the normal duration of the job and the corresponding cost, the urgent (emergency) duration of the job and the costs corresponding to it, the cost of accelerating the work per unit of time. The last value in the interval between the urgent and normal duration of work is assumed to be constant, i.e. the acceleration of work and the growth of costs are connected by a linear relationship. Suppose that for the work of the graph shown in Fig. 10.11, the indicated data are known:


7.1.NETWORK PLANNING
Network planning is one of the forms of graphical reflection of the content of work and the duration of the plans. As a rule, network planning is used in the preparation of strategic plans and long-term complexes of various types of enterprise activities (design, planning,
organizational, etc.).
Along with line graphs and tabular calculations, network planning methods are widely used in the development of long-term plans and models of complex production systems and other objects of long-term use.
The network work plans of the enterprise for the creation of new competitive products contain not only the total duration of the entire complex of design, production and financial and economic activities, but also the duration and sequence of individual processes or stages, as well as the need for the necessary economic resources.
For the first time, schedules for the implementation of production processes were applied to American firms by G. Gant. On linear (tape) graphs along the horizontal axis, on a selected scale, the duration of work is plotted for all "stages, stages of production. The content of work cycles (with the necessary degree of their division into separate parts or elements) is depicted along the vertical axis. Linear graphs are usually used at domestic enterprises in the process of short-term or operational planning of production activities.The main drawback of such schedules is the impossibility of closely linking individual works into a single production system or the overall process of achieving the planned final goals of the enterprise.
Unlike line charts, network planning serves as the basis for economic and mathematical calculations, graphical and analytical calculations, organizational and management decisions, operational and strategic plans. Network planning provides not only an image, but also modeling, analysis and optimization of projects for the implementation of complex technical tasks, design developments, etc.
Under network planning, it is customary to understand a graphical representation of a certain set of work performed, which not only reflects their logical sequence, existing relationship and planned duration, but also ensures the subsequent optimization of the developed schedule in order to use it for current work progress management.
Network planning is based on graph theory. Under count refers to a set of points (nodes) connected by lines. The direction of the lines is shown by arrows. The segments connecting the vertices are called edges (arcs) of graphs. A directed graph is a graph on which the arrows indicate the directions of all its edges, or arcs. Graphs are called maps, labyrinths, networks and diagrams.
Graph theory operates with concepts such as paths, contours, etc. Path- this is a series connection of arcs, i.e. the end of each previous segment coincides with the beginning of the next one. Contour - is a path whose start vertex is the same as the end vertex. In other words, a network graph is a directed graph without contours, whose arcs (edges) have one or more numerical characteristics. On the graph, the edges are jobs, and the vertices are events.
work any production process or other actions leading to the achievement of certain results is called. The work is also considered the possible waiting for the start of subsequent processes associated with breaks or additional time costs. Work-waiting usually requires the expenditure of working time without the use of resources, for example, cooling of heated workpieces, hardening of concrete, etc. In addition to real jobs and work-expectations, there are fictitious jobs, or dependencies. A fictitious work is a logical connection or dependence between some final processes or events that does not require time. On the graph, the fictitious work is represented by a dashed line.
events the final results of previous work are considered. The event fixes the fact of work performance, specifies the planning process, excludes the possibility of different interpretations of various processes and works. Unlike work, as a rule, having its own duration in time,
The event represents only the moment of completion of the planned action, for example: the goal is selected, the plan is drawn up, the goods are produced, the products are paid for, the money is received, etc. Events are initial (initial) or final (final), simple or complex, as well as intermediate, preceding or subsequent, etc.
There are three main ways to depict events and jobs in network diagrams: job nodes, event nodes, and mixed networks.
In "top-to-work" networks, all processes or actions are represented as rectangles following one after another, connected by logical dependencies.
As can be seen from the network diagram (Fig. 1), it depicts a simple model, or network, consisting of five interconnected activities: A, B, C, D, and E. The initial activity is A, followed by intermediate activities B, C, and D and further final work D.

In networks of the "nodes-event" type, all jobs or actions are represented by arrows, and events are represented by circles (Fig. 2). This network diagram depicts a simple production process that includes six interrelated events: 0, 1, 2, 3, 4, and 5. The initial event in this case is the zero event, the fifth event is the final one, and all the others are intermediate.

Network schedules serve not only for planning a variety of work, but also for their coordination between project managers and executors, as well as for the rational use of production resources.
Network planning is successfully used in various areas of business and production activities, such as:
Marketing research;
Research work;
Design of developmental developments;
Implementation of organizational and technological projects;
Development of experimental and serial production of products;
Construction and installation of industrial facilities;
Repair and modernization of technological equipment;
Development of business plans for the production of new goods;
Restructuring of existing production in market conditions;
Preparation and placement of various categories of personnel;
Innovation management, etc.
The use of network planning in modern production contributes to the solution of strategic and operational problems. Network planning allows you to:
1) reasonably choose the development goals of each division of the enterprise, taking into account existing market requirements and planned final results;
2) clearly establish detailed tasks for all divisions and services of the enterprise on the basis of their interconnection with a single strategic goal in the planning period;
3) involve experienced and highly qualified executors of the upcoming work in the preparation of project plans;
4) distribute and rationally use the resources of the enterprise more efficiently;
5) predict the progress of the main stages of work, and timely adjust the deadlines;
6) conduct a multivariate economic analysis of various technological methods and the sequence of ways to perform work, as well as the distribution of resources.
7) promptly receive the necessary planned data on the actual state of the progress of work, costs and results of production.
8) to link the long-term overall strategy and short-term specific chains of the enterprise in the process of planning and managing work.
The most important stages of network planning of production
Breakdown of the complex of works into separate components and their
assignment to responsible executors;
Identification and description by each performer of the events and work necessary to achieve the goal;
Construction of primary network schedules and clarification of the content of the planned work;
Linking private networks and building a consolidated network schedule for the implementation of a set of works;
Justification or clarification of the execution time of each work in the network diagram.
The breakdown (dismemberment) of the complex of planned works is carried out by the project manager. In the course of network planning, two methods of distribution of work performed are used: division of functions between performers (horizontal distribution); building a scheme of project management levels (vertical distribution). In the first case, a simple system or object is subdivided into separate processes, parts or elements, for which an enlarged network diagram can be built. Then each process is divided into operations, techniques and other settlement actions. Each component of the work package has its own network schedule. In the second case, a complex designed object is divided into separate parts by building a known hierarchical structure of the corresponding levels of project management.
Drawing up network schedules at each level is carried out by their leaders or responsible executors. Each of the following in the network planning process:
o draws up a primary network schedule for a given amount of work;
o evaluates the progress of the work assigned to him and provides the necessary information to his management;
o participates together with employees of production units or functional bodies in the preparation of planning and management decisions;
o ensures the implementation of decisions made.
Primary network schedules, built at the level of responsible executors, should be detailed in such a way that they can reflect both the entire set of work performed and all existing relationships between individual works and events. First, it is necessary to identify what events will characterize the complex of works entrusted to the responsible executor. Each event should establish the completion of previous actions, for example: the project goal is chosen, design methods are justified, competitiveness indicators are calculated, etc. It is recommended to list all events and works included in the given complex in the order of their execution.
The linking of the network diagram is carried out by the responsible executor on the basis of the established list of works.
The final stage of network planning is the determination of the duration of individual work or cumulative processes. In deterministic models, the duration of work is considered unchanged. In real conditions, the execution time of various works depends on a large number of factors (both internal and external) and therefore is considered a random variable. To establish the duration of any work, it is necessary first of all to use the relevant standards or norms of labor costs. In the absence of initial regulatory data, the duration of all processes and works can be established by various methods, including using expert assessments.
The duration of the planned process should be assessed by the most experienced experts, managers or responsible executors of the work. When choosing an assessment, it is necessary to use the reference and regulatory materials available in the production as much as possible.
The resulting estimate should be considered as a temporary guideline or a possible option for the duration of the work. When design conditions change, the established estimates must be adjusted during the implementation of network schedules.
In the process of network planning, expert estimates of the duration of the upcoming work are usually set by the responsible executors. For each job, as a rule, several time estimates are given: the minimum T min , maximum T tyah and most likely T iv. If the duration of work is determined by only one estimate of time, then it may turn out to be far from reality, which will lead to a violation of the entire progress of work according to the network schedule. The assessment of the duration of work is expressed in man-hours, man-days or other units of time.
Minimum time - this is the smallest possible working time for the execution of the designed processes. The probability of doing the work for such a time is small. Max Time- this is the longest time to complete the work, taking into account the risk and extremely unfortunate set of circumstances. most likely time- this is a possible or close to the real conditions of the time to complete the work.
The obtained most probable estimate of time cannot be accepted as a normative indicator of the expected time for the completion of work, since in most cases this estimate is subjective and largely depends on the experience of the responsible work executor. Therefore, in order to determine the expected time to complete each job, expert estimates are subjected to statistical processing.
In the practice of network planning, the most common method is the critical path (vertex-event network), in which the nodes represent the beginning or end of the final event of the work process and are depicted by circles, and the work itself - by arrows.
The practical structuring of the project begins with the compilation of a list of works, in which all types of work are given with the appropriate symbols. It is quite difficult to define and thus distinguish between types of work. It is important to observe the level of detail appropriate to the problem. The list of works contains the characteristics of the materials and capacities necessary for their implementation by types (personnel, machines, tools), terms and volumes.
In conclusion, causal relationships between the works are consistently established. This is done either by setting the parameters of some jobs that immediately precede other jobs, or by specifying the immediately following jobs. After that, an appropriate network plan is drawn up.
Network planner ing is a method of planning work, operations in which, as a rule, are not repeated (for example, the development of new products, the construction of buildings, the repair of equipment, the design of new works).
To carry out network planning, it is first necessary to divide the project into a number of separate works and draw up a logical scheme (network graph).
Work- these are any actions, labor processes, accompanied by the cost of resources or time and leading to certain results. On the network graphs, work is indicated by arrows. To indicate that one job cannot be performed before another, fictitious jobs are introduced, which are depicted by dotted arrows. The duration of the fictitious work is assumed to be zero.
Event- this is the fact of the completion of all the works included in it. It is believed that it happens instantly. On the network graph, events are depicted as graph vertices. None of the work leaving this event can begin before the end of all the work included in this event.
FROM initiating event(which has no previous work) the project starts. final event(which has no subsequent work) ends the project.
After building a network graph, it is necessary to estimate the duration of each work and highlight the work that determines the completion of the project as a whole. It is necessary to assess the need for each work in resources and revise the plan, taking into account the provision of resources.
Often a network graph is called network diagram.
Rules for constructing network graphs.
1. There is only one final event.
2. There is only one initial event.
3. Any two events must be directly connected by no more than one arrow job. If two events are linked by more than one job, it is recommended to introduce an additional event and a dummy job:
4. There should be no closed loops in the network.
5. If for the execution of one of the jobs it is necessary to obtain the results of all the jobs included in the event preceding it, and for another job it is enough to get the result of several of these jobs, then you need to introduce an additional event that reflects the results of only these last jobs, and a fictitious work that connects a new event with the previous one.
For example, to start work D, it is enough to finish work A. To start work C, you need to finish work A and B.

Critical Path Method
The critical path method is used to manage fixed-time projects.
It allows you to answer the following questions:
1. How long will it take to complete the entire project?
2. What time should the individual
work?
3. What works are critical and must be completed within a precisely defined time schedule so as not to disrupt the established deadlines for the project as a whole?
4. How long can non-critical work be delayed without impacting project timelines?
The longest path of the network diagram from the initial event to the final one is called the critical one. All events and activities on the critical path are also called critical. The duration of the critical path determines the duration of the project. There can be several critical paths in a network diagram.
Consider the main time parameters of network graphs.
Denote t (i, j)- duration of work with the initial event i and end event j.
Early term t p (j) of the event j- this is the earliest moment by which all the work preceding this event is completed. Calculation rule:
t p (j) = max ( t p (i) + t (j))
where the maximum is taken over all events i, immediately preceding the event j(connected by arrows).
Late date t n (i) of the event i- this is such a limiting moment, after which exactly as much time remains as is necessary to complete all the work following this event.
Calculation rule:
t n (i) = min ( t n (j)- t (i, j))
where the minimum is taken over all events j, immediately following the event i.
Reserve R(i) developments i shows how long the event can be delayed i without violating the term of the end event:
R (i) \u003d t n (i) - t p (i)
Critical events have no reserves.
When calculating the network diagram, each circle depicting an event is divided by diameters into 4 sectors:

Project management with undefined lead times
In the critical path method, it was assumed that we know the execution time of the work. In practice, these terms are usually not defined. It is possible to build some assumptions about the time of completion of each work, but it is impossible to foresee all possible difficulties or delays in execution. To manage projects with an indefinite lead time, the most widely used project evaluation and review method, calculated on the use of probabilistic estimates of the execution time of the work provided by the project.
For each job, three grades are entered:
- optimistic time a- the smallest possible time of performance of work;
- pessimistic time b- the greatest possible time of performance of work;
- most likely time t- the expected time to complete the work under normal conditions.
By a, b and t find expected time to complete the job:
and expected duration variance t:
Using values t, find the critical path of the network.
Network Graph Optimization
The cost of completing each job plus additional costs determines the cost of the project. With the help of additional resources, you can achieve a reduction in the time to complete critical work. Then the cost of these works will increase, but the total time of the project will decrease, which may lead to a decrease in the total cost of the project. It is assumed that the work can be completed either in the standard or in the minimum time, but not in the interval between them.
Gantt Chart
Sometimes it is useful to visualize the available slack. For this, it is used Gantt chart. On it every work ( i, j) is depicted as a horizontal segment, the length of which in the corresponding scale is equal to the time of its execution. The beginning of each job coincides with the early completion date of its start event. The Gantt chart is very useful in scheduling work. It shows working time, downtime and relative system load. Pending jobs can be distributed to other work centers.
The Gantt chart is used to manage work in progress. It indicates which work is running on schedule and which is ahead or behind it. There are many ways to use the Gantt chart in practice.
It is worth noting that the Gantt chart does not take into account the variety of production situations (for example, breakdowns or human errors that require repetition of work). The Gantt schedule should be regularly recalculated when new work appears and when the duration of work is reviewed.
The Gantt chart is especially useful when working on a project with unrelated activities. But when analyzing a project with closely related activities, it is better to use the critical path method.
Resource allocation, resource schedules
Until now, we have not paid attention to resource constraints and assumed that all the necessary resources (raw materials, equipment, labor, cash, production facilities, etc.) are available in sufficient quantities. Consider one of the simplest methods for solving the problem of resource allocation - "trial and error".
Example. Let's optimize the network graph by resources. The available resource is 10 units.

The first number assigned to the arc of the graph means the time to complete the work, and the second - the required amount of resource to complete the work. Work does not allow interruption in their performance.

Finding the critical path. We build a Gantt chart. In parentheses for each job, we indicate the required amount of resource. According to the Gantt chart, we build a resource graph. On the abscissa we plot time, and on the y-axis we plot resource requirements.

We believe that all work begins as soon as possible. Resources are added up for all jobs running at the same time. We will also draw a limit line on the resource (in our example, this is y= 10).

From the graph, we see that in the segment from 0 to 4, when jobs B, A, C are simultaneously performed, the total need for resources is 3 + 4 + 5 = 12, which exceeds the limit of 10. Since work C is critical , then we must move the deadlines for either A or B.

Let's schedule the execution of work B from the 6th to the 10th day. This will not affect the timing of the entire project and will make it possible to stay within resource constraints.
Job parameters
Recall the notation: t (i, j)- duration of work ( i, j); t p (i)- early date of the event i; t n (i)- late date of the event /.
If there is only one critical path in the network diagram, then it is easy to find it by critical events (events with zero time reserves). The situation becomes more complicated if there are several critical paths. After all, both critical and non-critical paths can pass through critical events. In this case, you need to use critical work.
Early start date (i, j) coincides with the early date of the event i: t p n (i, j) = t p (i).
Early end of work (i, j) is equal to the sum t p (i) and t (i, j):t p o (i, j) = t p (i) + t (i, j).
Late start date (i, j) is equal to the difference t n (j)(late date of completion of the event j) and t (i, j): t mon (i, j) = t p (j) - t (i, j).
Late end of work (i, j) coincides with t n (j): t by (i, j) = t p (j).
Full slack R n ( i, j) work (i, j) - this is the maximum margin of time for which you can delay the start of work or increase its duration, provided that the entire complex of work is completed within a critical time:
R n ( i, j) \u003d t n (j) - t p (i) - t (i, j) \u003d t by (i, j) - t p o (i, j).
Free time reserve R with ( i, j) work (i, j)- this is the maximum margin of time for which you can delay or (if it started at its early date) increase its duration, provided that the early dates of all subsequent work are not violated: R c ( i, j)= t p (j) - t p (i) - t (i, j)= t p (j) - t p o (i, j).
Critical works, like critical events, have no reserves.
Example. Let's see what are the reserves of work for the network graphics.

We find t p (i), t n (i) and make a table. The values of the first five columns are taken from the network diagram, and the remaining columns are calculated from these data.

| Work (i, j) | Duration t (i, j) | t p (i) | t p (j) | t n (j) | Start date | |
| t p n (i, j) = t p (i) | t mon (i, j) = t p (j) - t (i, j) | |||||
| (1,2) | 6-6 = 0 | |||||
| (1,3) | 7-4 = 3 | |||||
| (1,4) | 8-2 = 6 | |||||
| (2,4) | 8-2 = 6 | |||||
| (2,5) | 12-6 = 6 | |||||
| (3,5) | 12-5 = 7 | |||||
| (4,5) | 12-4 = 8 |
| Work (i, j) | End date of work | Working time reserves | ||
| t p o (i, j) = t p (i) + t (i, j) | t by (i, j) = t p (j) | Full R n ( i, j)= = t over (i, j) - t p o (i, j) | Free R with ( i, j)= = t p (j) - t p o (i, j) | |
| (1,2) | 0 + 6 = 6 | 6-6 = 0 | 6-6 = 0 | |
| (1,3) | 0 + 4 = 4 | 7-4 = 3 | 4-4 = 0 | |
| (1,4) | 0 + 2 = 2 | 8-2 = 6 | 8-2 = 6 | |
| (2,4) | 6 + 2 = 8 | 8-8 = 0 | 8-8 = 0 | |
| (2,5) | 6 + 6= 12 | 12-12 = 0 | 12-12 = 0 | |
| (3,5) | 4 + 5 = 9 | 12-9 = 3 | 12-9 = 3 | |
| (4,5) | 8 + 4=12 | 12-12 = 0 | 12-12 = 0 |
Critical works (works with zero reserves): (1, 2), (2.4), (2, 5), (4, 5). We have two critical paths: 1 - 2 - 5 and 1 - 2 - 4 - 5.
Network planning and management methods allow you to focus on the most important points for the implementation of the project. At the same time, it is required that the work be mutually independent, that is, within a certain sequence of work, you can start, suspend, exclude work, and also perform one work independently of another work. All work must be performed in a certain sequence. Therefore, network planning and management methods are widely used in construction, aircraft and shipbuilding, as well as in industries with rapidly changing trends.
Skepticism about network planning and management methods is often based on their cost, which can be about 5% of the total project cost. But these costs are usually fully offset by the savings achieved through a more accurate and flexible schedule, as well as a reduction in project timelines.


, poultry farming")


- Burns, Robert - short biography
- The concept of common vocabulary and vocabulary of limited use
- Nancy Drew: The Captive Curse Walkthrough Nancy Drew Curse of Blackmoore Manor Walkthrough
- Deadpool - Troubleshooting
- Won't start How to Survive?
- What to do if bioshock infinite won't start
- Walkthrough Nancy Drew: Alibi in Ashes
- Spec Ops: The Line - game review, review Spec ops the line crashes on missions
- Room escape level 1 walkthrough
- Processing tomatoes with boric acid How much will 2 grams of boric acid
- Cucumber Grass (Borago)
- Bioinsecticide Lepidocid: purpose, properties and application procedure Lepidocide waiting period
- How to change the language to Russian in steam
- Dendrobium noble: room care
- Morphology of plants general concepts - document
- Planting, propagation and care of bamboo at home, photo Growing bamboo from seeds
- How to strengthen the cellular signal for the Internet in the country
- Sanskrit reveals the forgotten meaning of Russian words (2 photos)
- The oldest language Sanskrit programming language of the future Dead language Sanskrit
- Who has dominion over all the earth?